|
|
|
|
|
|
|
|
|
|
|
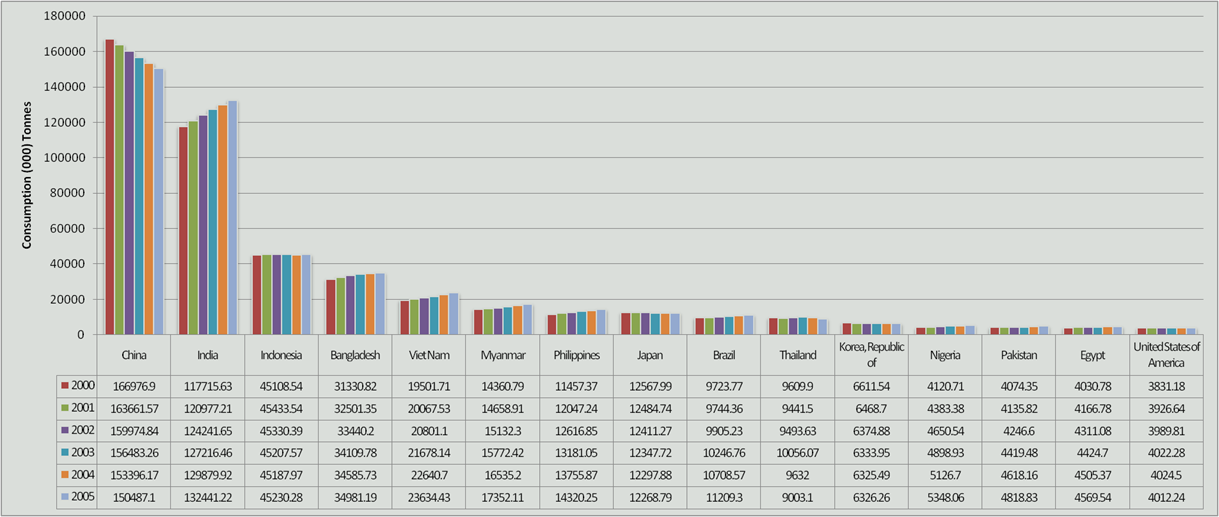
World
Consumption of RICE |
|
|
Consumption in (000) Tonnes |
|
|
S.No. |
Countries |
2000 |
2001 |
2002 |
2003 |
2004 |
2005 |
|
|
1 |
China |
166976.9 |
163661.57 |
159974.84 |
156483.26 |
153396.17 |
150487.1 |
|
|
2 |
India |
117715.63 |
120977.21 |
124241.65 |
127216.46 |
129879.92 |
132441.22 |
|
|
3 |
Indonesia |
45108.54 |
45433.54 |
45330.39 |
45207.57 |
45187.97 |
45230.28 |
|
|
4 |
Bangladesh |
31330.82 |
32501.35 |
33440.2 |
34109.78 |
34585.73 |
34981.19 |
|
|
5 |
Viet Nam |
19501.71 |
20067.53 |
20801.1 |
21678.14 |
22640.7 |
23634.43 |
|
|
6 |
Myanmar |
14360.79 |
14658.91 |
15132.3 |
15772.42 |
16535.2 |
17352.11 |
|
|
7 |
Philippines |
11457.37 |
12047.24 |
12616.85 |
13181.05 |
13755.87 |
14320.25 |
|
|
8 |
Japan |
12567.99 |
12484.74 |
12411.27 |
12347.72 |
12297.88 |
12268.79 |
|
|
9 |
Brazil |
9723.77 |
9744.36 |
9905.23 |
10246.76 |
10708.57 |
11209.3 |
|
|
10 |
Thailand |
9609.9 |
9441.5 |
9493.63 |
10056.07 |
9632 |
9003.1 |
|
|
11 |
Korea, Republic of |
6611.54 |
6468.7 |
6374.88 |
6333.95 |
6325.49 |
6326.26 |
|
|
12 |
Nigeria |
4120.71 |
4383.38 |
4650.54 |
4898.93 |
5126.7 |
5348.06 |
|
|
13 |
Pakistan |
4074.35 |
4135.82 |
4246.6 |
4419.48 |
4618.16 |
4818.83 |
|
|
14 |
Egypt |
4030.78 |
4166.78 |
4311.08 |
4424.7 |
4505.37 |
4569.54 |
|
|
15 |
United States of America |
3831.18 |
3926.64 |
3989.81 |
4022.28 |
4024.5 |
4012.24 |
|
|
Total of top
15 Countries |
461021.98 |
464099.27 |
466920.37 |
470398.57 |
473220.23 |
476002.7 |
|
|
Total of other
141 Countries |
48547.5 |
49925.16 |
51373.58 |
53199.66 |
55278.42 |
57188.8 |
|
|
World Total |
509569.48 |
514024.43 |
518293.95 |
523598.23 |
528498.65 |
533191.5 |
|
|
Source:FAO |
|
|
|
|
|
|
|
|
|
|
|
|
|
|
|
|
|
|
|
|
|
|
|
|
|
|
|
|
|
http://www.amis.pk |
|
|
|
|
|
|
|
|
|
|
|