|
|
|
|
|
|
|
|
|
|
|
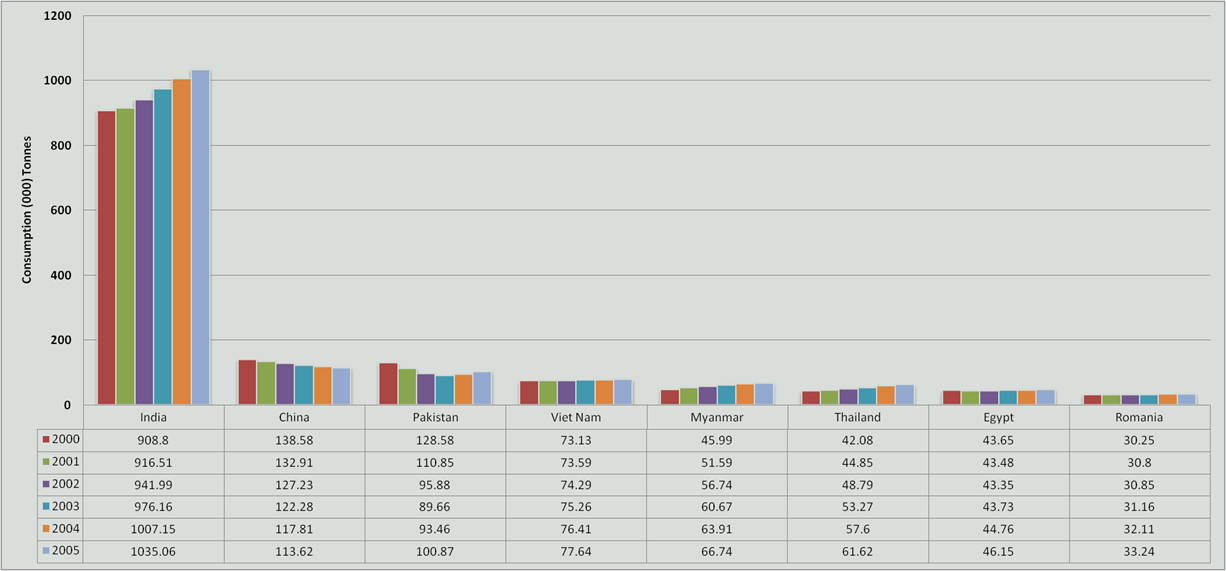
World
Consumption of DRY CHILLI |
|
|
Consumption in (000) Tonnes |
|
|
S.No. |
Countries |
2000 |
2001 |
2002 |
2003 |
2004 |
2005 |
|
|
1 |
India |
908.8 |
916.51 |
941.99 |
976.16 |
1007.15 |
1035.06 |
|
|
2 |
Bangladesh |
122.79 |
140.42 |
149.7 |
153.86 |
156.08 |
157.91 |
|
|
3 |
China |
138.58 |
132.91 |
127.23 |
122.28 |
117.81 |
113.62 |
|
|
4 |
Ethiopia |
108.82 |
109.25 |
109.59 |
110.17 |
111.13 |
112.33 |
|
|
5 |
Pakistan |
128.58 |
110.85 |
95.88 |
89.66 |
93.46 |
100.87 |
|
|
6 |
United States of America |
55.4 |
61.85 |
71.64 |
78.86 |
81.59 |
81.04 |
|
|
7 |
Viet Nam |
73.13 |
73.59 |
74.29 |
75.26 |
76.41 |
77.64 |
|
|
8 |
Mexico |
50.08 |
54.12 |
59.01 |
62.16 |
64.47 |
66.78 |
|
|
9 |
Myanmar |
45.99 |
51.59 |
56.74 |
60.67 |
63.91 |
66.74 |
|
|
10 |
Hungary |
35.82 |
39.62 |
45.18 |
51.38 |
57.55 |
63.66 |
|
|
11 |
Thailand |
42.08 |
44.85 |
48.79 |
53.27 |
57.6 |
61.62 |
|
|
12 |
Malaysia |
29.41 |
34.99 |
40.58 |
46.49 |
52.8 |
59.2 |
|
|
13 |
Egypt |
43.65 |
43.48 |
43.35 |
43.73 |
44.76 |
46.15 |
|
|
14 |
Nigeria |
42.65 |
42.57 |
42.6 |
42.8 |
43.15 |
43.55 |
|
|
15 |
Romania |
30.25 |
30.8 |
30.85 |
31.16 |
32.11 |
33.24 |
|
|
Total of top
15 Countries |
1856.03 |
1887.4 |
1937.42 |
1997.91 |
2059.98 |
2119.41 |
|
|
Total of other
141 Countries |
337.84 |
350.95 |
360.34 |
373.35 |
380.43 |
388.41 |
|
|
World Total |
2193.87 |
2238.35 |
2297.76 |
2371.26 |
2440.41 |
2507.82 |
|
|
Source:FAO |
|
|
|
|
|
|
|
|
|
|
|
|
|
|
|
|
|
|
|
|
|
|
|
|
|
|
|
|
|
|
|
|
http://www.amis.pk |
|
|
|
|
|
|
|
|
|
|
|