|
|
|
|
|
|
|
|
|
|
|
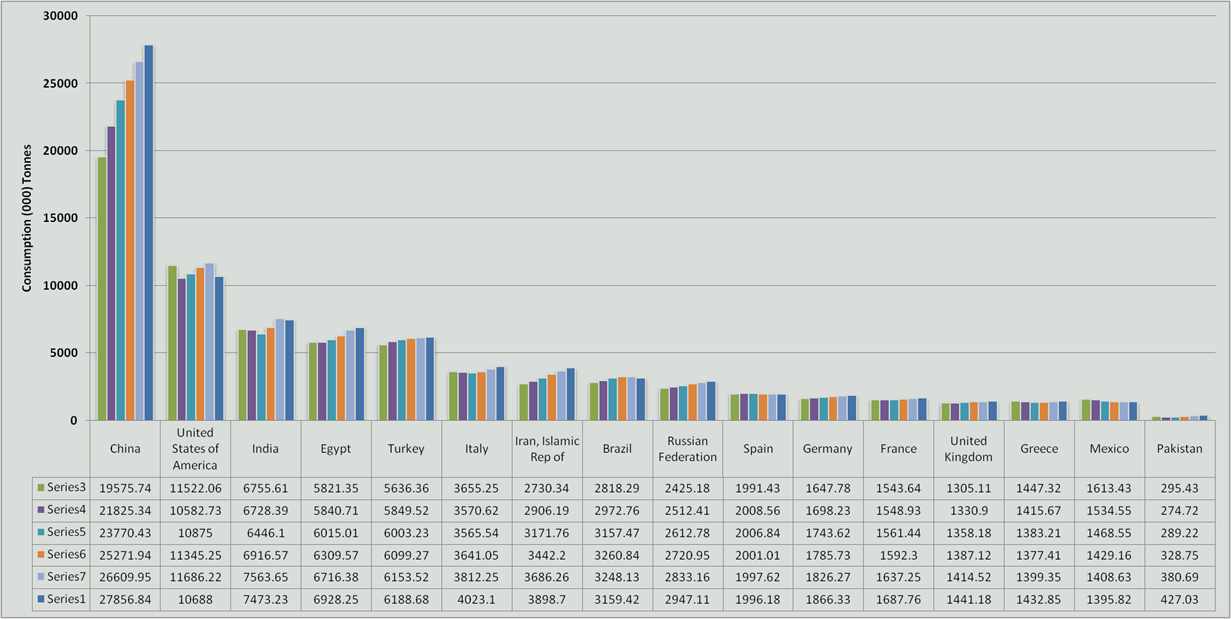
World
Consumption of TOMATO |
|
|
Consumption in (000) Tonnes |
|
|
S.No. |
Countries |
2000 |
2001 |
2002 |
2003 |
2004 |
2005 |
|
|
1 |
China |
19575.74 |
21825.34 |
23770.43 |
25271.94 |
26609.95 |
27856.84 |
|
|
2 |
United States of America |
11522.06 |
10582.73 |
10875 |
11345.25 |
11686.22 |
10688 |
|
|
3 |
India |
6755.61 |
6728.39 |
6446.1 |
6916.57 |
7563.65 |
7473.23 |
|
|
4 |
Egypt |
5821.35 |
5840.71 |
6015.01 |
6309.57 |
6716.38 |
6928.25 |
|
|
5 |
Turkey |
5636.36 |
5849.52 |
6003.23 |
6099.27 |
6153.52 |
6188.68 |
|
|
6 |
Italy |
3655.25 |
3570.62 |
3565.54 |
3641.05 |
3812.25 |
4023.1 |
|
|
7 |
Iran, Islamic Rep of |
2730.34 |
2906.19 |
3171.76 |
3442.2 |
3686.26 |
3898.7 |
|
|
8 |
Brazil |
2818.29 |
2972.76 |
3157.47 |
3260.84 |
3248.13 |
3159.42 |
|
|
9 |
Russian Federation |
2425.18 |
2512.41 |
2612.78 |
2720.95 |
2833.16 |
2947.11 |
|
|
10 |
Spain |
1991.43 |
2008.56 |
2006.84 |
2001.01 |
1997.62 |
1996.18 |
|
|
11 |
Germany |
1647.78 |
1698.23 |
1743.62 |
1785.73 |
1826.27 |
1866.33 |
|
|
12 |
France |
1543.64 |
1548.93 |
1561.44 |
1592.3 |
1637.25 |
1687.76 |
|
|
13 |
United Kingdom |
1305.11 |
1330.9 |
1358.18 |
1387.12 |
1414.52 |
1441.18 |
|
|
14 |
Greece |
1447.32 |
1415.67 |
1383.21 |
1377.41 |
1399.35 |
1432.85 |
|
|
15 |
Mexico |
1613.43 |
1534.55 |
1468.55 |
1429.16 |
1408.63 |
1395.82 |
|
|
16 |
Pakistan |
295.43 |
274.72 |
289.22 |
328.75 |
380.69 |
427.03 |
|
|
Total of top
16 Countries |
70784.32 |
72600.23 |
75428.38 |
78909.12 |
82373.85 |
83410.48 |
|
|
Total of other
140 Countries |
24323.78 |
24789.47 |
25473.38 |
26492.4 |
27736.19 |
28996.8 |
|
|
World Total |
95108.1 |
97389.7 |
100901.76 |
105401.52 |
110110.04 |
112407.28 |
|
|
Sourec:FAO |
|
|
|
|
|
|
|
|
|
|
|
|
|
|
|
|
|
|
|
|
|
|
|
|
|
|
|
|
|
|
|
|
|
|
http://www.amis.pk |
|
|
|
|
|
|
|
|
|
|
|